| February 5, 2018 | No.106 |
January 2018
(Back Issues Here)
January 2018 is over and here are the rainfalls totals for the month. Here at the Palmira Station we had 0.83 inches of rain in January.
The reports from around the District of Boquete for January are in the table below:
Rainfall for January 2018 |
|||
Area |
Contributors |
January |
Total 2018 |
El Santuario |
Terry Zach |
5.52 |
5.52 |
Jaramillo Arriba |
Steve Sarner |
7.98 |
7.98 |
Jaramillo Abajo |
Don Berkowitz |
1.43 |
1.43 |
Jaramillo Abajo |
Bobi McGann |
3.01 |
3.01 |
El Salto Arriba |
Rodrigo Marciacq |
3.27 |
3.27 |
Brisas Boquetenas |
Austin Perry |
1.10 |
1.10 |
Los Molinos |
Sela Burkholder |
2.56 |
2.56 |
Santa Lucia |
Paula Litt |
n/a |
n/a |
Lucero (Cielo Paraiso) |
Michael Mullin |
2.61 |
2.61 |
Palmira Abajo |
Betty Gray |
0.56 |
0.56 |
Palmira Arriba |
Lloyd Cripe |
0.84 |
0.84 |
n/a = not currently available but will be posted when available |
|||
There is considerable variability reported this month. The Palmira area had the least rainfall. Jaramillo Arriba had the most. Steve Sarner reports 7.98 inches up in Jaramillo Arriba. He reports that this is the most rain they have ever seen in January. Terry Zach reports 5.52 in El Santuario.
This pattern is not unusual for January. While we are well into the dry season, weather on the other side of the mountains and the Caribbean coast area often have significant rain this time of the year. The NE Trade Winds push the moisture across the Caribbean and over the mountains into our area and the northern Boquete areas gets mist from this known as the "Bajareque" rain. Our records for 10 years at the Palmira Station show an average of 0.48 inches of rain in the month of January with a range between 0.0 to 2.09. Steve's report of 7.98 inches for January is certainly the highest amount seen in the 10+ years we have been observing.
We have a new contributor to our rainfall data this month. Rodrigo Marciacq is collecting rain data and will share it with us. He is located in El Salto Arriba at 1706 meters (5597 feet). We have never had any reports from this higher altitude area on the slope of Baru where a major part of Boquete's agriculture land is located. We are looking forward to his contribution.
If any of you want to start collecting rain data and sharing it with us, let me know. Here is a link to a good quality manual rain gauge. It needs to be placed in an open area on a post with minimal obstacles nearby (trees and buildings). You have to check it regularly and write down the data on a log. It isn't complicated but it takes a dedicated diligence. Think about becoming a contributor.
Several have asked me "Why we do get the wind and misty weather this time of year?" Of course this is why we also get the beautiful rainbows. I will try and explain by looking at some images of the current weather of today.
Up north in America there is a large cold air mass pushing south and creating a cold front. Note in this surface analysis map there is a large air mass and high pressures associated with it.
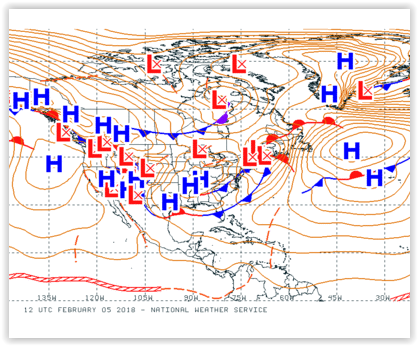
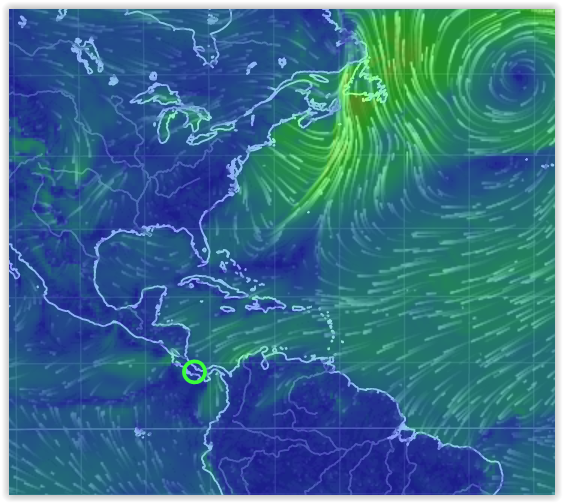
Our area is a always a low pressure area associated with the ITCZ (candy striped line). High pressure always wants to go toward low pressure. So the air from the high pressure areas rush into our low pressure area near the ITCZ. This basically causes the NE Trade Winds. Note this graphic of the current winds associated with the pressures.
The current visible satellite image reveals some cloud buildup on the Caribbean side of the mountains but there is not enough moisture in the air to be blowing over on our side that much. We basically have clear skies with wind today.
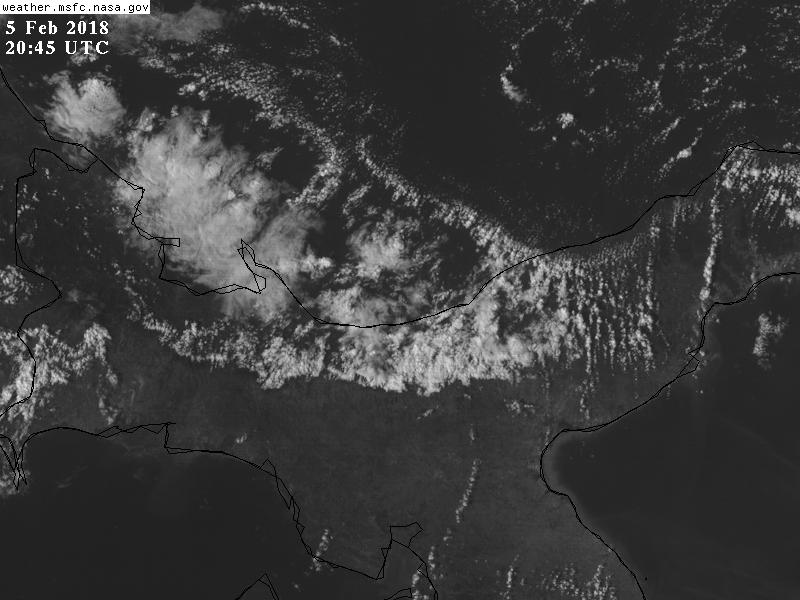
Below is what the visible satellite image looked like last month on a day with wind and lots of mist (Bajareque) blowing into our area:
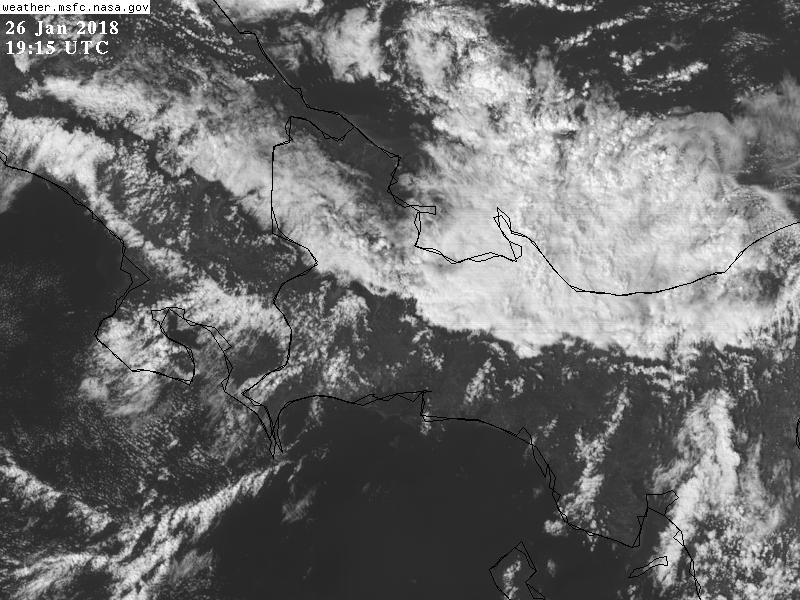
This should give you some idea of how this works and also some idea of how to look at various images and figure out what is happening.
I had to change the Satellite links at the website because NOAA stopped in November using GOES-East for imaging our part of the world. They are now using a new satellite GOES-16 and they no longer service the links we had been using for 10 years. I am trying to get used to these new links. It is a bit different. You now click on the image you want to go to (Visible, Infrared or Water Vapor) from our website and an image of the world comes up. You then click on that world image at the location of Panama to get the information our area.
The latest ENSO Cycle Report is now saying that "La Niña conditions are present. Equatorial sea surface temperatures (SSTs) are below average across the central and eastern Pacific Ocean. La Niña is likely (~85%-95%) through the Northern Hemisphere winter with a transition to ENSO neutral expected during the spring."
If you want to learn more about El Niño, this is a good website to understand the phenomenon and its effects on our climate and weather.The IRI (International Research Institute for Climate and Society) (select South America from the Region menu) is reporting the following precipitation predictions for February-March-April of 2018. Note a prediction of above normal precipitation for our area (green) but generally mixed for South America.
ETESA's, hydrology and meteorology section is predicting that parts of Chiriqui will have above normal levels of precipitation for the month of February 2018. You can read their report and check out the details for February 2018 in the documents section at this link.
If you want to see what Volcan Baru looks like from the south on a January Bajareque day check out this link.
Dr. Paul Myers, a retired geology professor from Vermont, is visiting Boquete. He will be giving some tours and a lecture at a BCP Tuesday morning meeting this month. Keep your eye out for the announcements and plan to attend to learn more about Volcan Baru and its expected behavior. Dr. Myers gave a lecture last year which was very informative and well attended. I highly recommend him to you.
Try to not blow away and keep the umbrellas at home!
Lloyd Cripe